
Key takeaways:
- Municipalities around the world are experiencing a unique opportunity to transform urban spaces to be more cyclist-friendly
- Bike lane density and connectivity help to make urban cycling safer, encouraging more people to replace personal vehicles with cycling
- Visualizing urban bike networks can motivate public discourse around improving bike network density and connectivity
With the surge in bicycle use over the course of the COVID-19 pandemic, municipalities around the world are experiencing a unique opportunity to transform urban spaces to be more cyclist-friendly. This includes building dense, well-connected bike infrastructure that makes it easier for cyclists to share busy city streets with cars.
What are the benefits of cyclist-friendly infrastructure?
By making travel safer and more accessible, cyclist-friendly infrastructure encourages people to get around using bicycles instead of personal vehicles. This phenomenon is refered to as a “modal shift.”
Modal Shift A change from widespread use of one form of transportation to another.
Often policymakers seek to induce a modal shift from less sustainable ways of getting around, like personal vehcicles, modes of transit such as public transit, walking, and cycling. These modes of transportation are desirable for growing urban populations because they are scalable: the number of users can be increased without having a major impact on noise, air pollution, and pedestrian safety — unlike personal vehicles. They also take up a smaller amount of space relative to the number of users they are able to transport, enabling more efficient use of land and public infrastructure spending.
By encouraging use of bicycles, dependency on other less-sustainables modes of transit such as personal vehicles can be reduced, improving the livability of cities. To achieve these benefits, however, cycling must be made attractive to users.
Why is bike network density and connectivity important?
To make cycling attractive to users, cyling infrastructure must be made accesssible and attractive. As a mode of transportation, cycling suffers from an incompatibility with road traffic that discourages less experienced riders from biking through cities. Campaigns such as Vision Zero have drawn attention to the unique dangers that urban cyclists face.
With the increase in cycling brought on by the pandemic, cylist fatalities have risen even further. According to the National Highway Traffic Safety Administration, 932 cyclists in the United States alone were killed in motor-vehicle traffic crashes in 2020, an 8.9% increase from the previous year.
Cycling infrastructure can reduce these deaths by creating safer spaces for cyclists to get around such as through the use of painted lines, protected bike lanes, and curb extensions. Removing safety concerns serves to encourage cycling, achieving the benefits of modal shift.
The most important components of cyclist-friendly infrastructure are density and connectivity.
Bike Network Density A measure of bike lane mileage within a given area.
Bike Network Connectivity A measure of the degree to which bike lanes intersect within a city.
Bike lane density has the largest impact on encouraging cycling, with each standard deviation in density associated with an increase 150 bike commuters per 10,000 total commuters. For connectivity, one standard deviation is correlated with an additional 37 bike commuters per 10,000 total commuters.
How can municipalities be encouraged to build dense, well-connected cycling infrastructure?
Quantitative methods of analyzing bike infrastructure are useful for urban planners, but images can be a powerful tool to motivate public discourse around improving bike network density and connectivity.
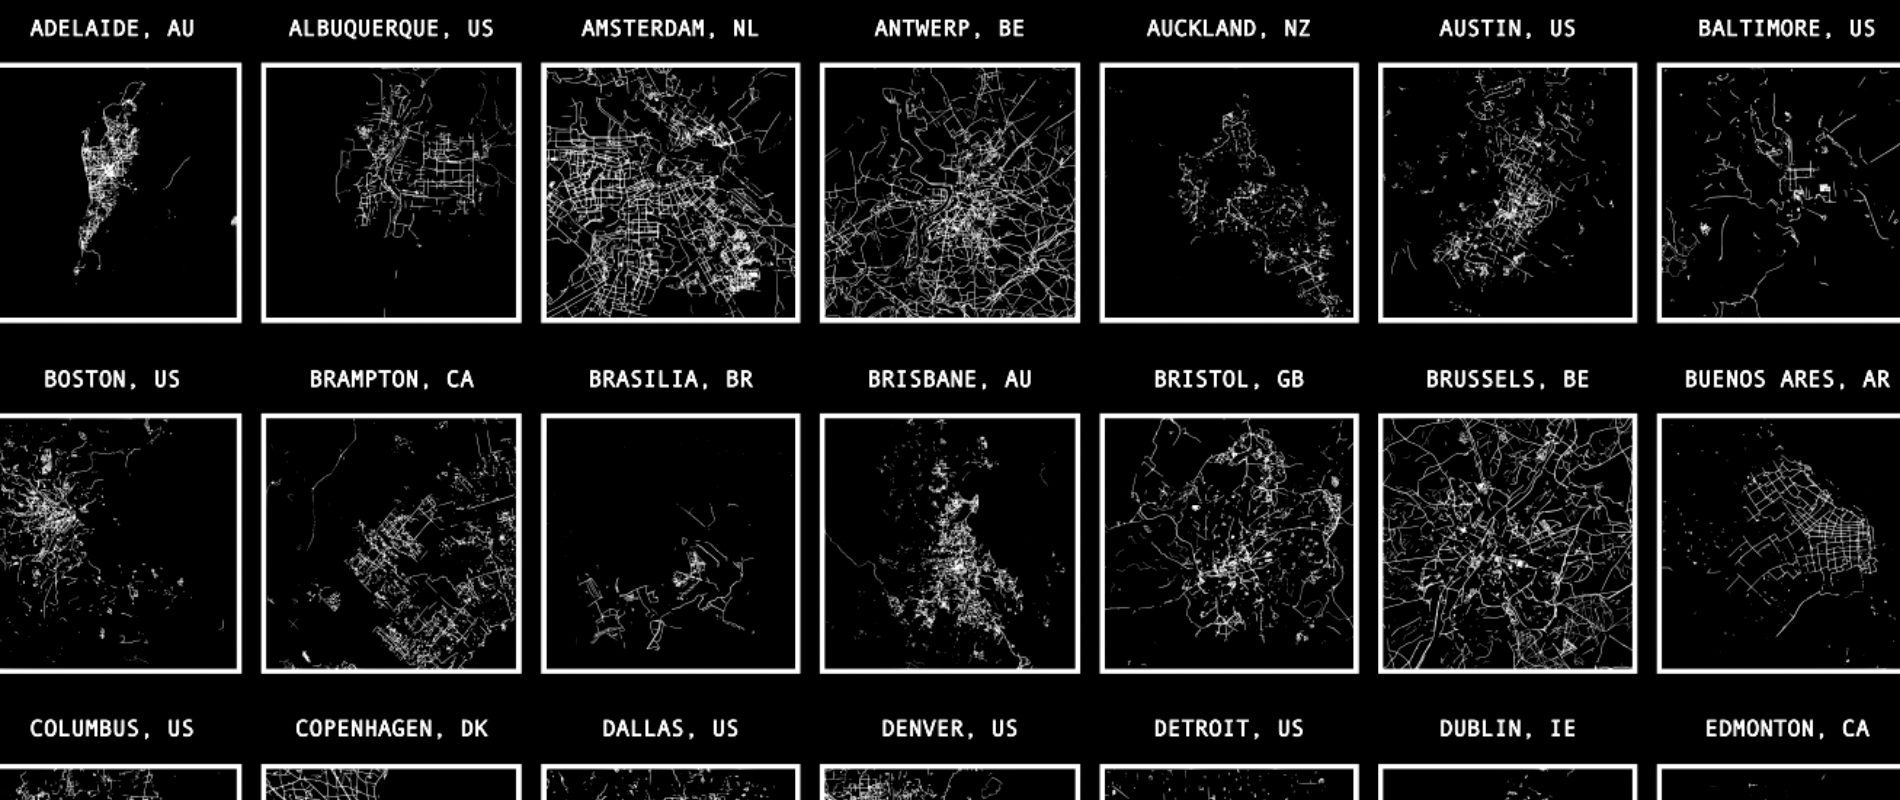
Using computer vision techniques and Google Map data, the bike networks in 100 cities around the world were visualized.

Cities were chosen based population and were limited to regions with bike lane data in Google maps.
Mapping bike networks in the way highlights differences between connectivity and density across cities. For example, the top three cyclist-friendly cities in the world (Copenhagen, Amsterdam, and Antwerp):
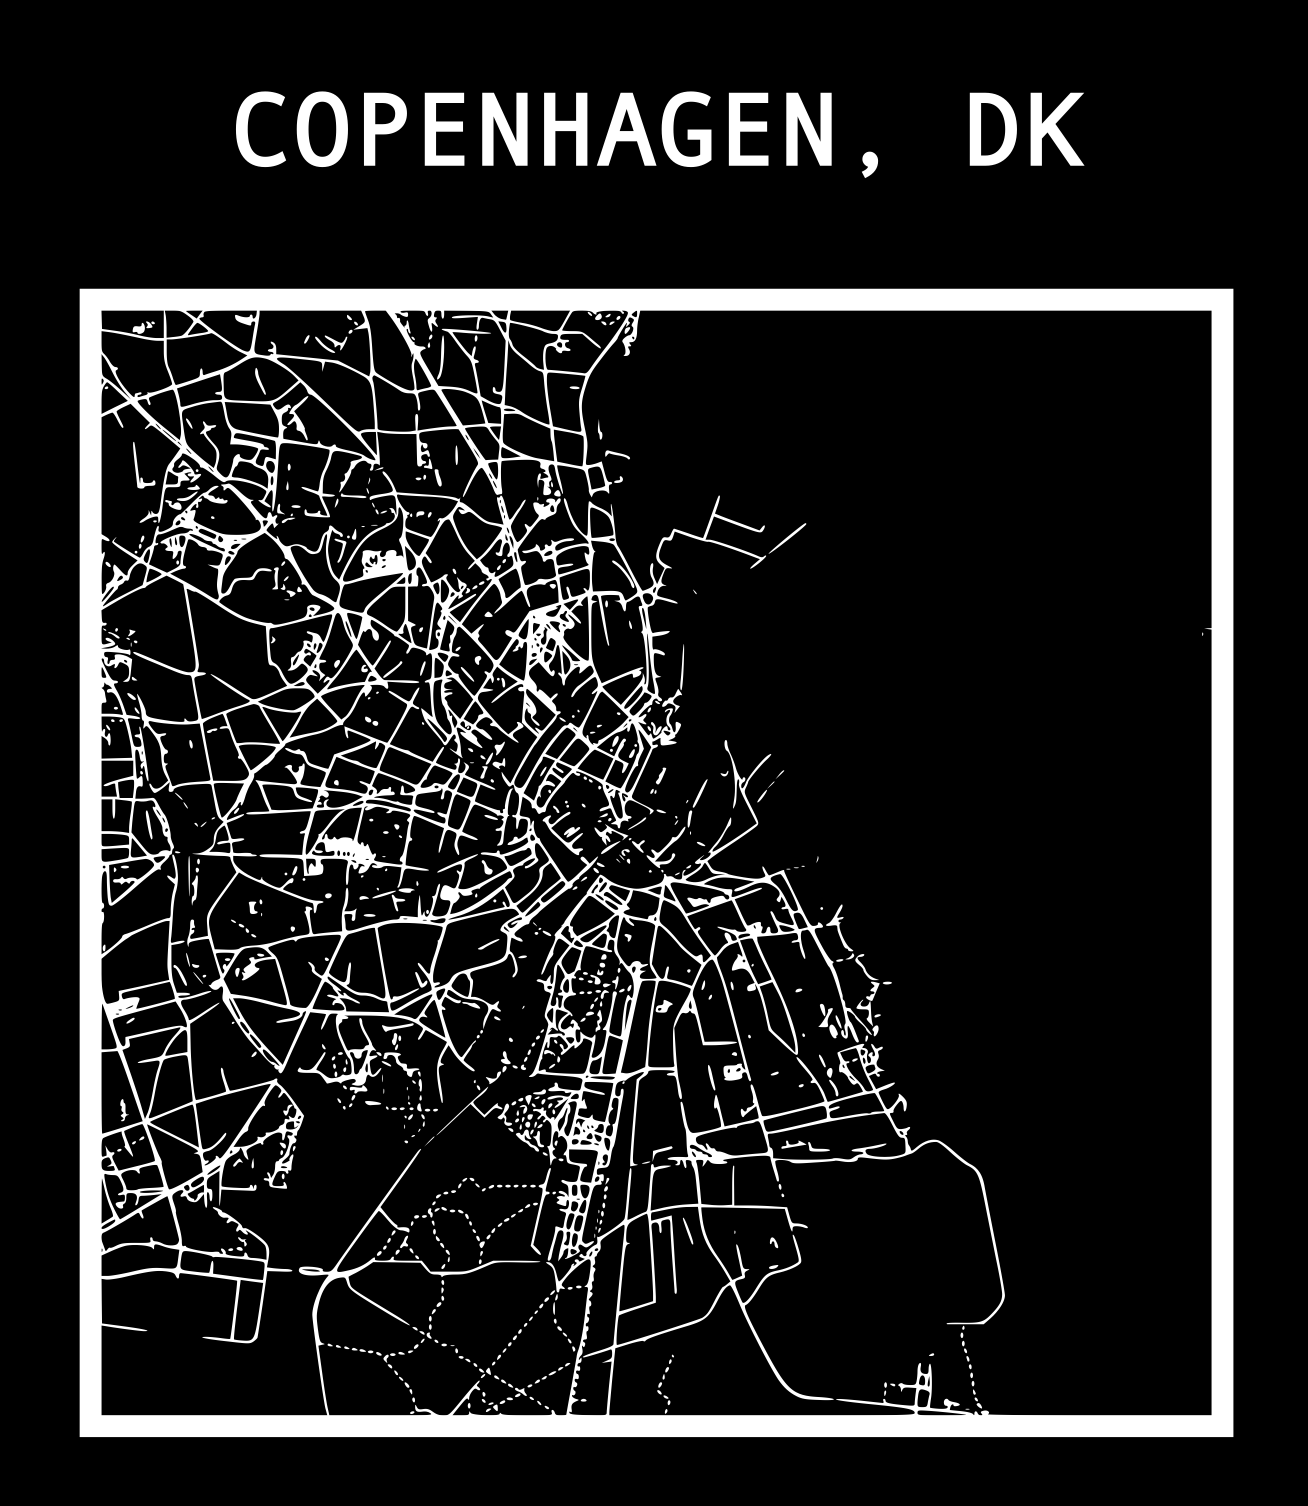
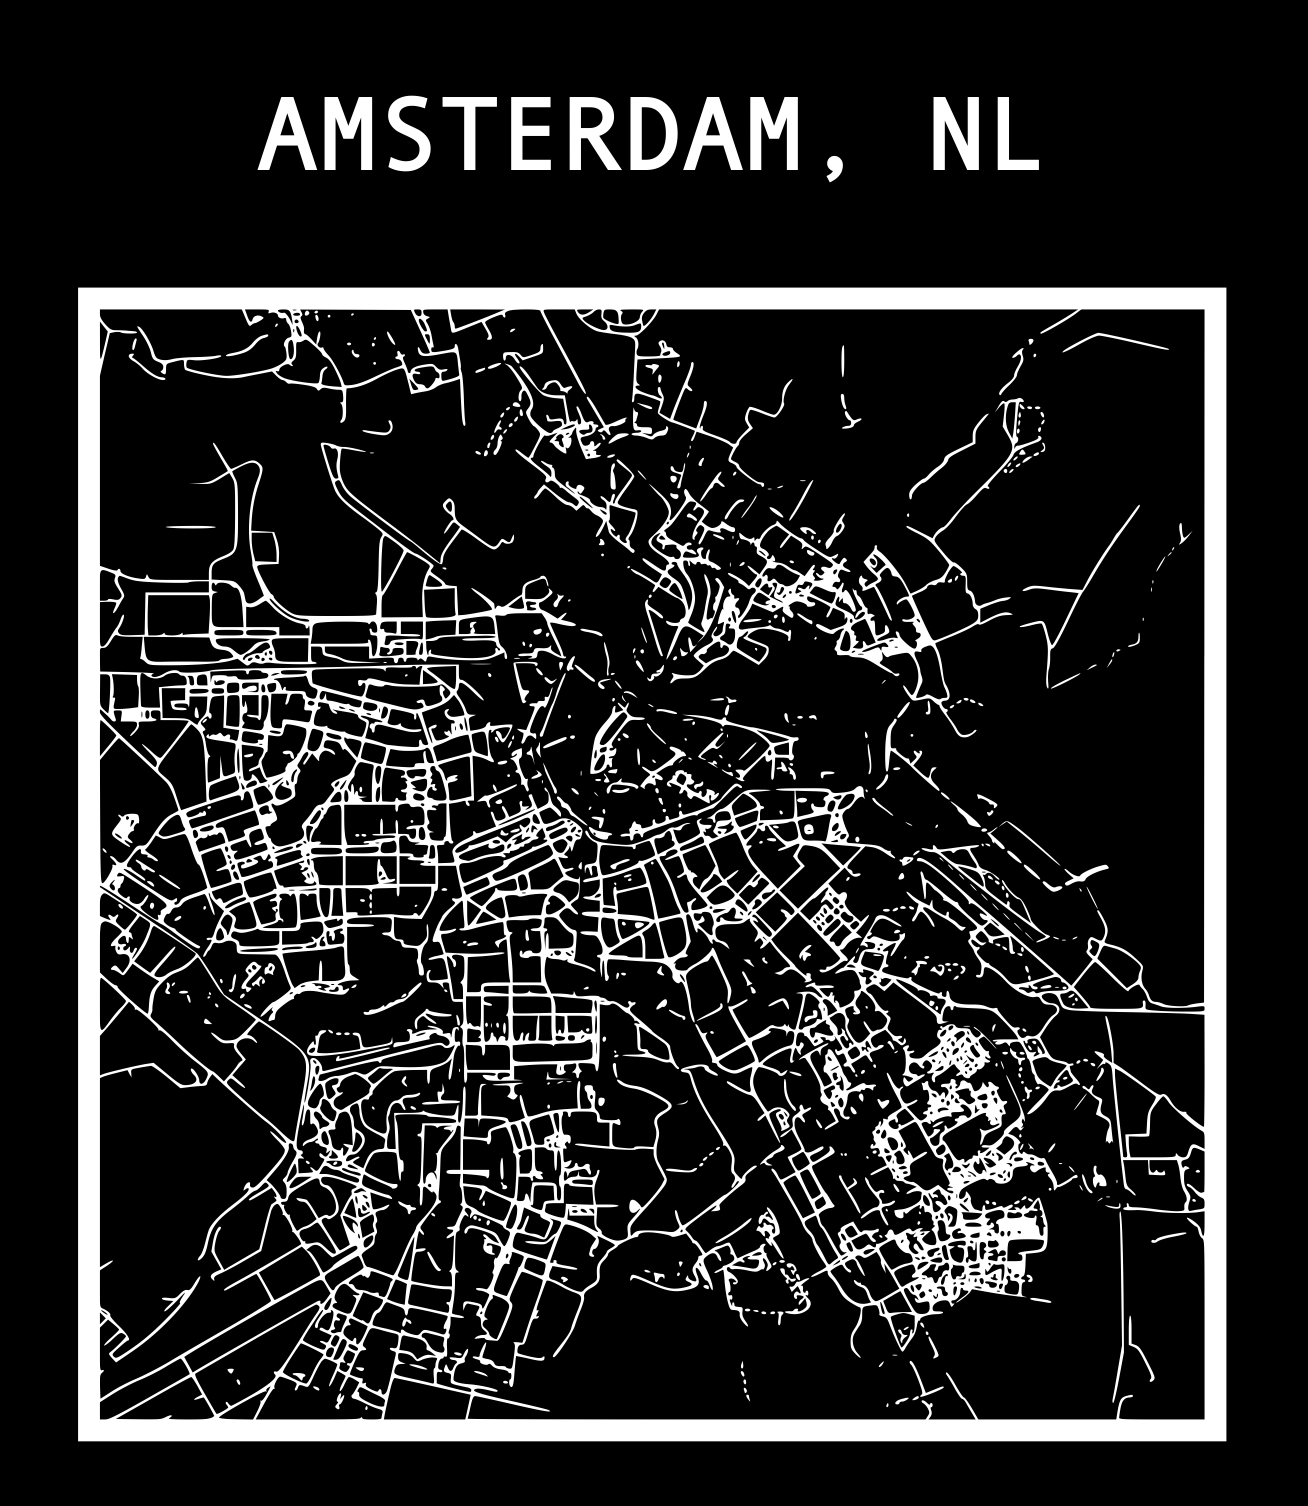

For these cities, the bike network is evidently very dense and well-connected. The city can be clearly recognized from the bike network alone, indicating that cylists should be able to traverse the city similarly to personal vechiles.
This is contrasted with the sparse, disconnected bike networks in cities with some of the least cyclist-friendly cities in the United States (Dallas, Nashville, and Memphis):


Here, the bike network is more fragmented and the city is almost unrecognizable from the map. Comparing cities this way allows one to imagine what the city would be like if road networks were built similarly to bike networks. It is evident that modal shift is unlikely to occur in cities where bike networks cannot compete with road networks.
The bike network maps can be used for advocacy in improving bike network density and connectivity within cities.

All materials have been made free to download here.